Ecommerce, once viewed primarily as a distribution channel, is now quietly becoming a strategic engine for innovation.
Image: Shutterstock
Advertisement
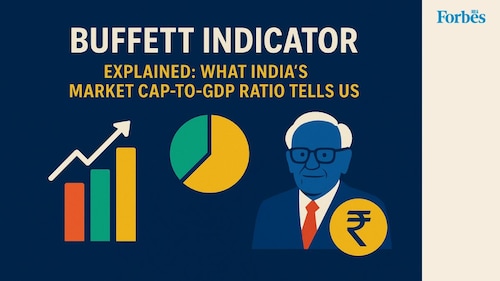
India’s stock market has seen a remarkable shift in scale over the last decade, in the number of retail participants and how valuations are tracked and discussed. Investors, big and small, often look for signals to make sense of where the market is headed. Among the various metrics used to assess overall market health, the market cap-to-GDP ratio remains a familiar reference point.
Known more popularly as the Buffett indicator, it stands alongside other tools like price-to-earnings ratios and interest rate benchmarks for gauging the market situation. While this isn’t the only metric investors use, it gives us a broad insight into whether the market is overheating or staying stable.
In this post, we’ll discuss what the Buffett indicator is, what it tells us about current valuations in India, and how it compares with other countries.
What is the Buffett indicator?
The Buffett indicator is a market valuation metric that compares a country"s total stock market capitalisation to its gross domestic product (GDP). In simple terms, it weighs the size of the stock market against the size of the country’s economy. If the market cap far exceeds the GDP, it could be a sign that stocks are overpriced.
While Warren Buffett, the American investor and philanthropist, didn’t invent this ratio, he popularised it after highlighting its predictive value in the early 2000s. He once called it “probably the best single measure of where valuations stand at any given moment." When the ratio hit record highs in 1999 and 2000, it was followed by a sharp market correction, which made the indicator more credible in the eyes of investors.
How is the Buffett indicator calculated?
Buffett indicator is calculated using a simple formula:
Market cap to GDP ratio = (Total Market Capitalisation à· Gross Domestic Product (GDP) of the country) à— 100
Here, the market capitalisation refers to the combined value of all publicly traded companies in a country, and GDP reflects the total economic output.
If the value exceeds 1 (or 100 per cent), it indicates that the stock market is valued higher than the size of the economy. For example, if India’s market cap is ₹300 lakh crore and the GDP is ₹250 lakh crore, the Buffett indicator would be 120 percent.
A value below 0.75 (75 percent) suggests the market may be undervalued. Between 75 and 90 percent is often considered reasonable. Anything above 100 percent signals possible overvaluation and growing risk.
India’s current Buffett indicator
India’s current Buffett indicator stands at 1.33 or 133 percent. Currently, India’s GDP is estimated at ₹300 lakh crore, while its listed market capitalisation is around ₹400 lakh crore. This gap reflects investor interest backed by strong liquidity, policy momentum, and long-term growth expectations, but it also calls for cautious optimism.
This is well above the country’s 10-year average of 0.93, and signals that the stock market is valued significantly higher than the size of the economy and has been increasing over the years. To put this in perspective, the ratio was 0.94 in 2020, and it crossed 100 percent in the following years. The lowest level India recorded was 0.23 in 2001, which preceded a major bull run.
Comparison with other countries
India’s Buffett indicator continues to draw attention as the country’s market cap-to-GDP ratio remains strong. For context, the U.S. had a market cap-to-GDP ratio of 1.84 as of March 2025, while Japan stood at 1.70 - both higher than India’s. Meanwhile, the UK (1.03) and Germany (0.61) were lower, and China’s reading was the lowest among major economies at around 0.56.
This highlights that while India’s stock market may seem stretched, it"s still positioned somewhere in the middle globally.
Strong macro factors like steady GDP growth, policy support, and consistent earnings have kept India’s ratio elevated. The current Buffett indicator of 1.33 reflects future potential rather than just overvaluation.
What are the limitations of the Buffett indicator?
Here are a few limitations to keep in mind:
Interest rate influence: Low interest rates tend to push stock prices higher by making borrowing cheaper and fixed-income returns less attractive. This can lift the market cap without any improvement in economic output, inflating the ratio.
Global exposure: Many large Indian companies earn the majority of their revenue from overseas markets. But, since the GDP only reflects domestic output, it can impact the ratio.
Sector-driven market cap: The market cap-to-GDP ratio doesn’t accurately reflect the growth rates of different sectors. Rapidly evolving industries like tech and finance may gain value quickly, while others like manufacturing grow slowly, impacting the overall ratio.
Works best with other metrics: On its own, the Buffett indicator gives a limited view. It’s more useful when compared with other valuation tools like P/E ratios or earnings growth.
How the Buffett indicator helps in investment decisions
While the market cap-to-GDP ratio can offer a useful perspective, it is most effective when used as part of a broader toolkit.
A higher ratio may suggest risks, while a lower one might hint at better long-term entry points for investments.
Always weigh it alongside other indicators - P/E ratios, interest rate movements, and company earnings, to build a more comprehensive view before making any investments.
If you’re investing across countries, the Buffett indicator can also help you spot which markets appear stretched and which ones might offer more value.
Use this indicator as a guide for smarter, more informed investment decisions in a fast-changing market.