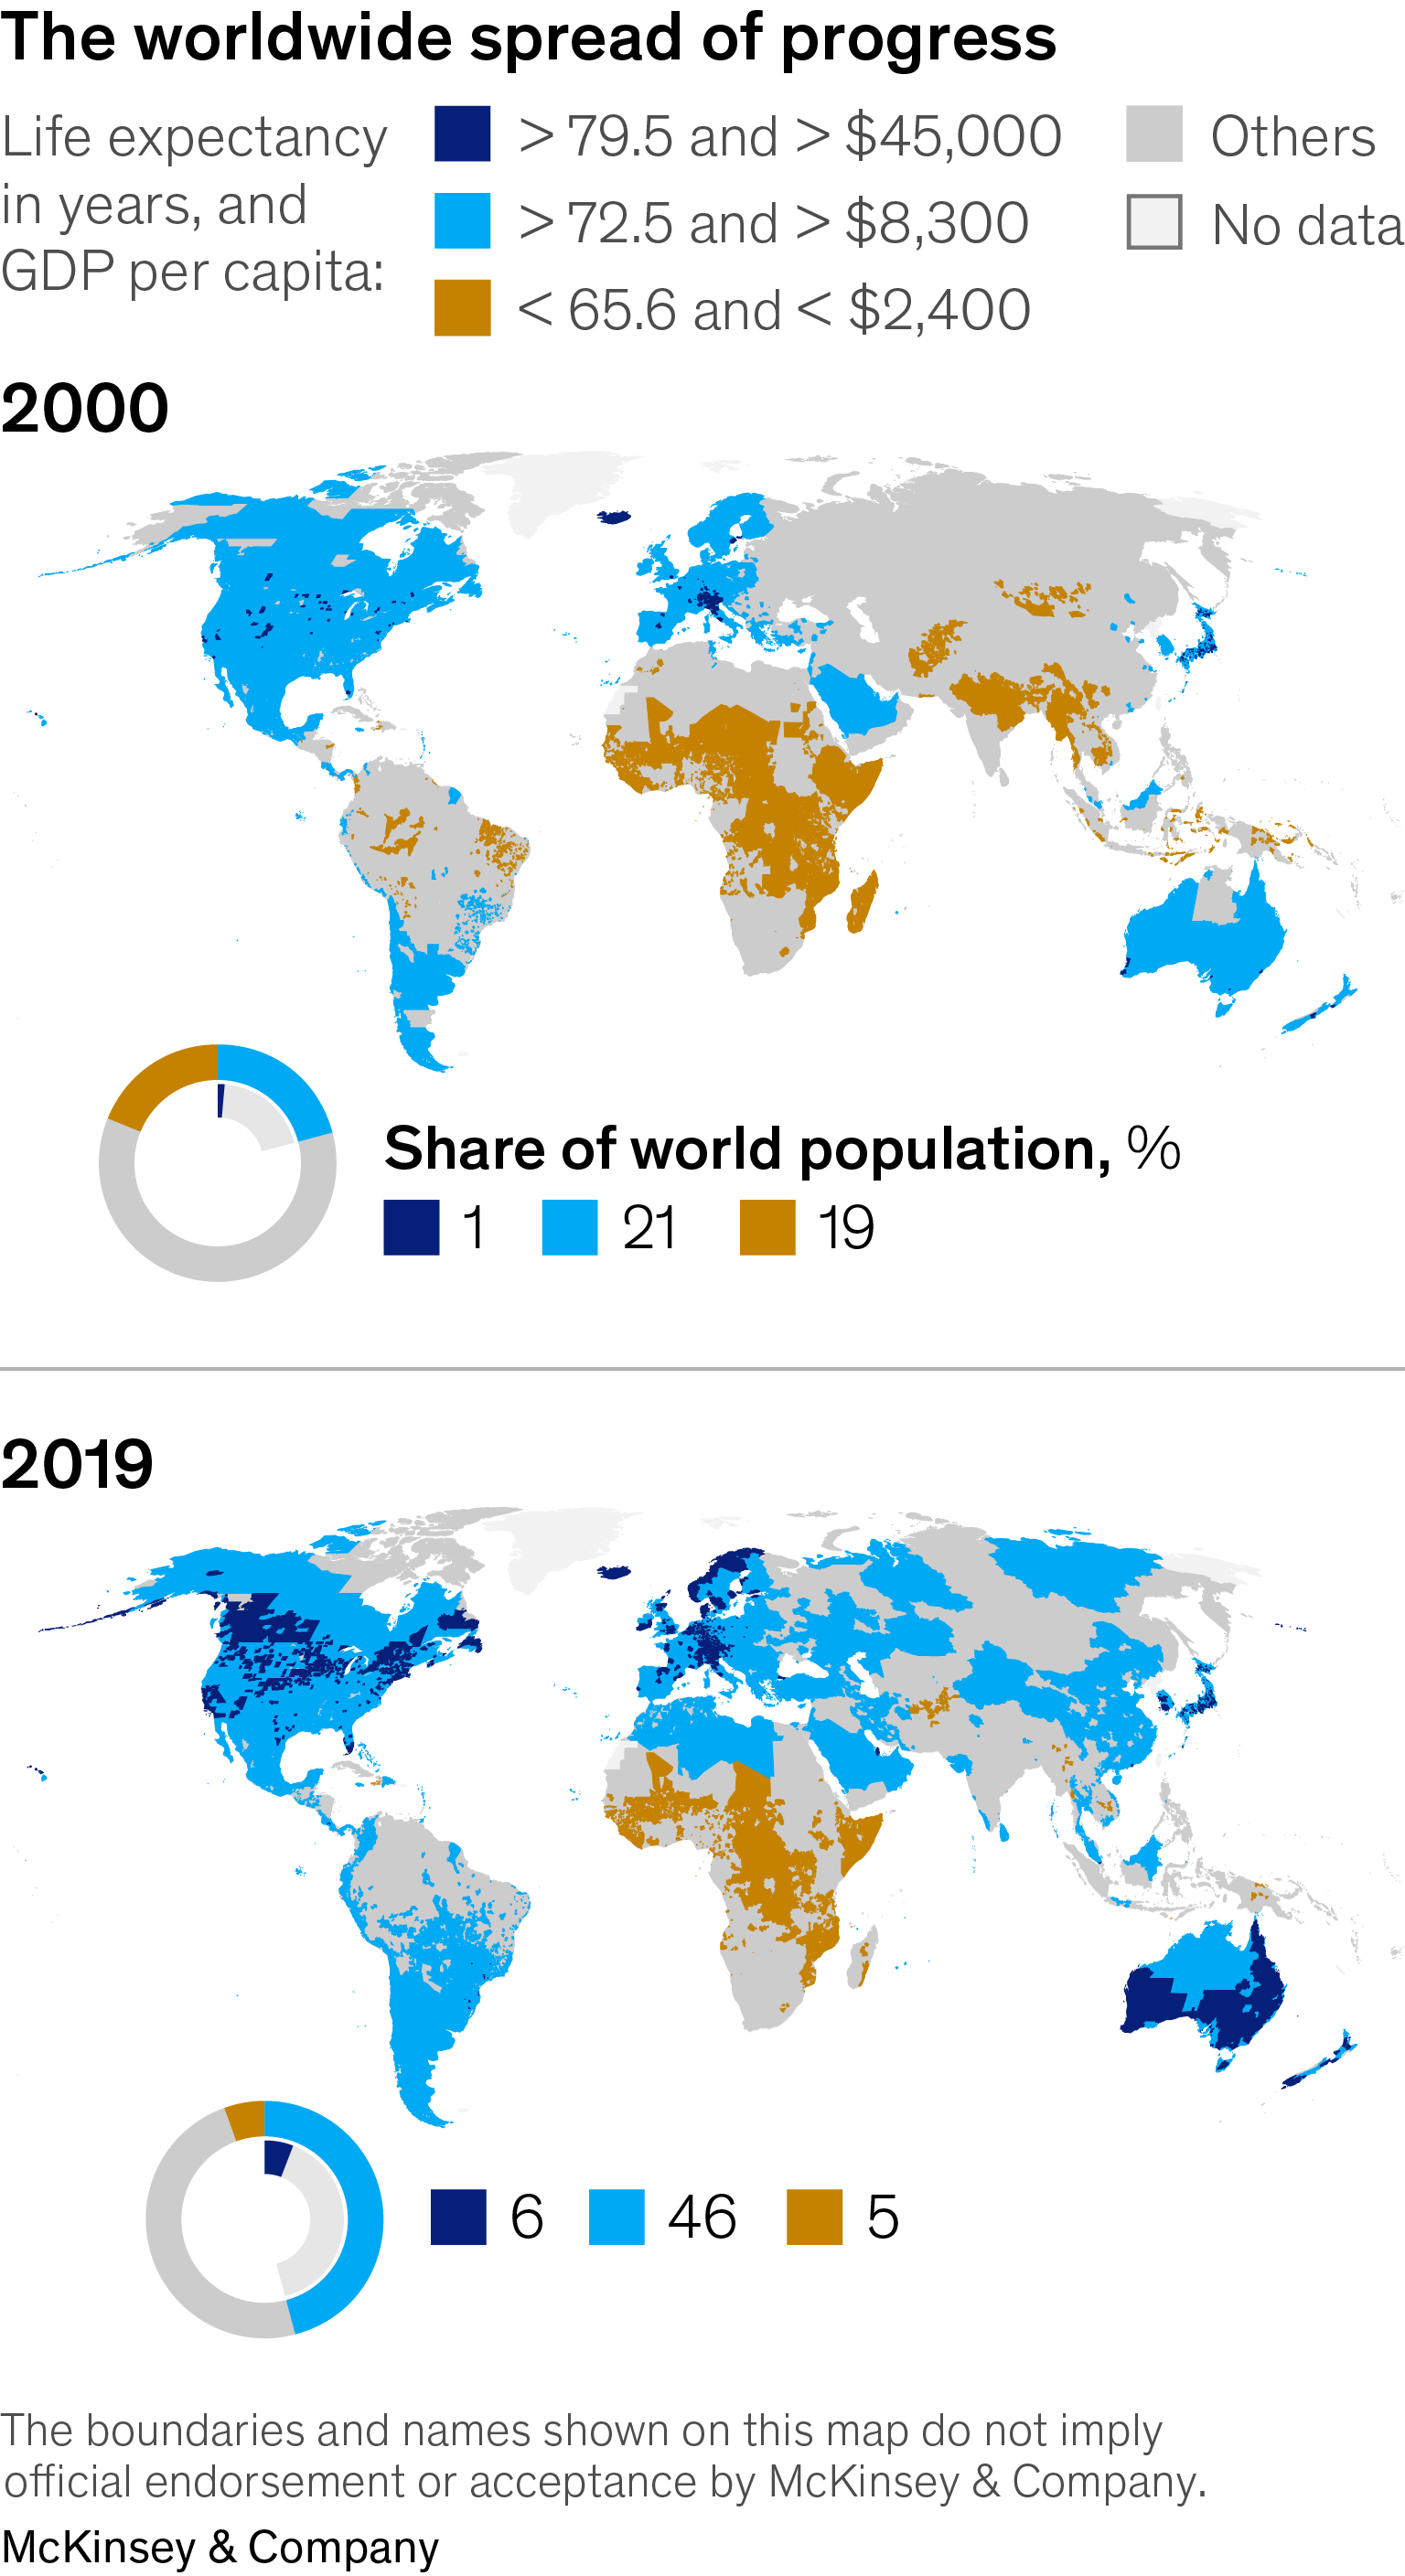
How evaluating 'granular' economic and social development improves decision-making

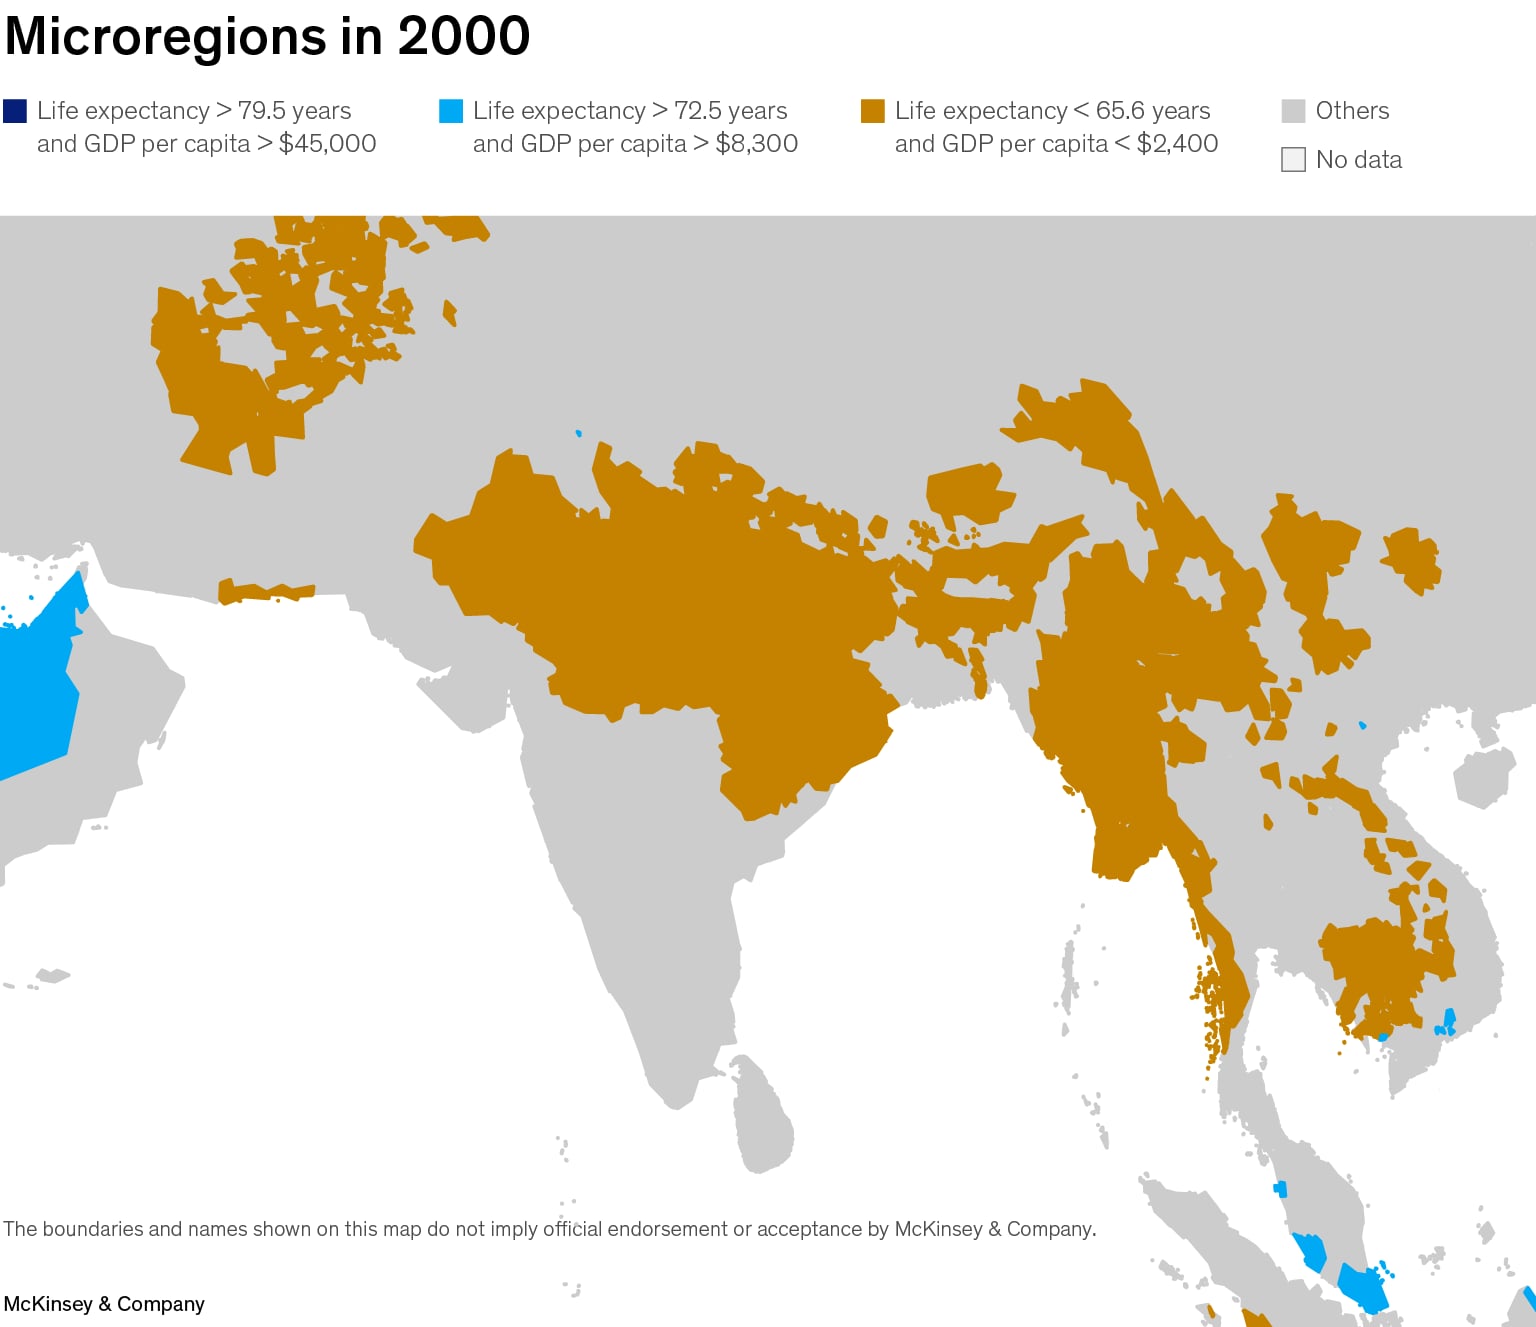
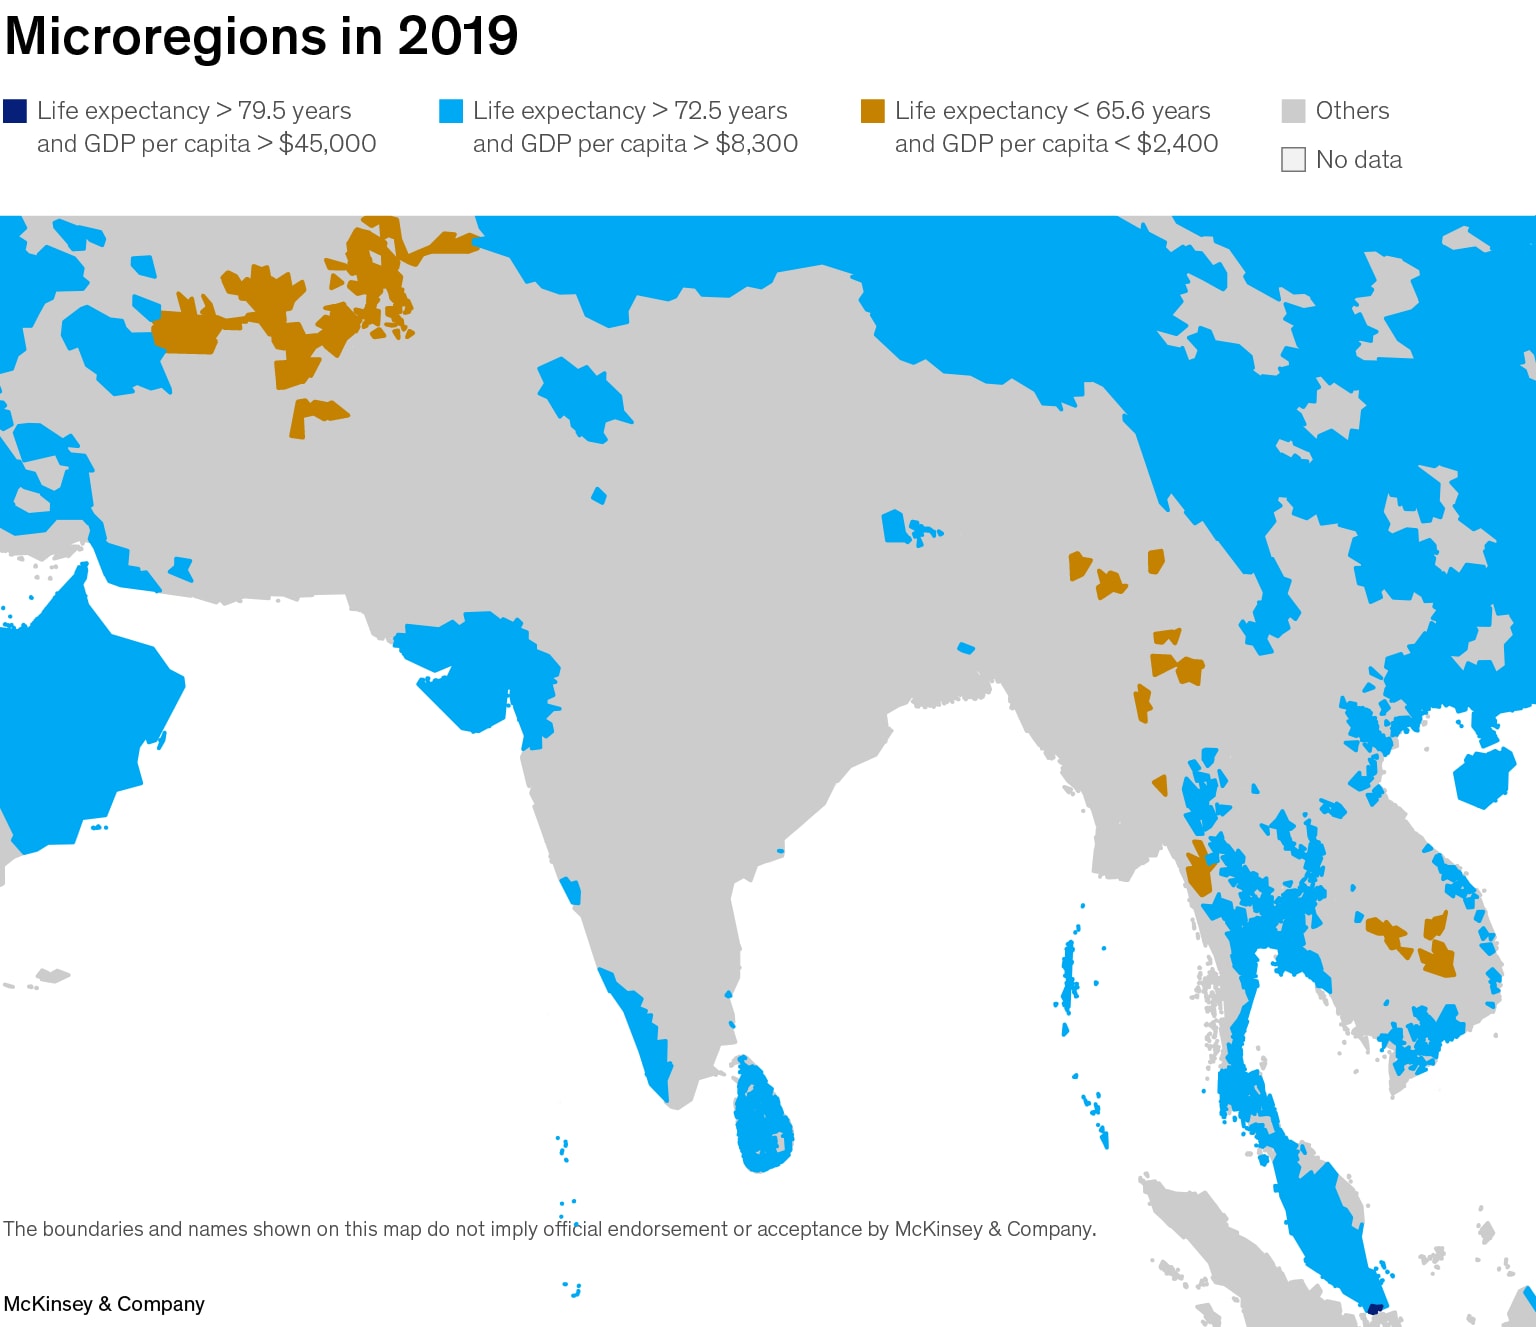
Understanding why the GDP per capita of Mapusa in Goa, India, is around $33,000, same as Porto, Portugal, even when India's per capita GDP hovers at $2,389 (per capital GDP of Portugal is 5X India's) could give an idea of how resources can be deployed where they are most needed

Updated: Aug 21, 2023 06:12:00 PM UTC
shutterstock_2133569335_SM
Image: Shutterstock

When trying to assess human progress, granularity matters. What we see as we get closer to the ground truth often differs from the picture painted at a national or subcontinental level.

With that in mind, the McKinsey Global Institute has deployed nighttime luminosity and other cutting-edge techniques to build a database that allows us to examine the world at a granularity 230 times greater than the view we get from country-level data sets. We move from 178 countries, averaging 40 million people, 700,000 square kilometres, and $700 billion of GDP in 2019, to 40,000 microregions, averaging 180,000 people, 3,000 square kilometres, and $3 billion of GDP.

The first thing immediately apparent in this zoomed-in view is that within-country differences are often far more pronounced than between-country variations. For example, Mapusa, in Goa, India, and Porto, Portugal, have the same GDP per capita, around $33,000—even though Portugal’s national GDP per capita is more than five times that of India’s.

McKinsey’s pixelated view also reveals that the world has experienced extensive progress in life expectancy and GDP per capita. By 2019, 3.5 billion people, or nearly half of the world’s population, lived in microregions with living standards equivalent to the top 21 percent in 2000—at GDP per capita above $8,300 and life expectancy greater than 72.5 years.

This progress occurred across all subcontinents, and a microregional lens reveals precisely where this has happened. More than one billion people lived in places where GDP per capita was below $2,400 and life expectancy lower than 65.6 years, or the bottom 30 percent globally in 2000. Twenty years later, the number of people living in such places had dropped to a little more than 400 million, despite the increasing population.

The global spread of progress

shutterstock_2133569335_SM

In 2000, almost half of India’s population, about 490 million people, lived in microregions in the bottom 30 percent. GDP per capita in Uttar Pradesh, India’s most populous state, was lower than $1,500, and life expectancy stood at 61.5 years. Odisha was recovering from a major cyclone, and its GDP per capita stood at $2,000 while life spans averaged 60.9 years.

Over 20 years, both states made significant progress. Income in Uttar Pradesh grew on average 5.6 percent annually, and by 2019, the GDP per capita there was above $4,000. Life expectancy increased by 7.5 years to reach 69 years. Odisha’s GDP per capita grew 5.7 percent yearly to $5,600, and life expectancy increased to 68.8 years.

Some Indian regions have gained in living standards over the last 20 years and have reached that of the top 30 percent of the world in 2000. Kerala, for example, already had a high life expectancy of 72.9 years in 2000, and its GDP per capita was about $3,400. By 2019, income there had almost tripled to $10,000, and longevity reached 76.1 years on average. Kerala’s life expectancy in 2019 was virtually the same as that of St Petersburg, Russia, where GDP per capita was more than three times that of Kerala.

Also Read: Why global bond yields have risen again and how they may affect the rupee

No Indian microregion experienced declining life expectancy over the 20 years—at a national level, it increased by 5.4 years on average. However, the gains varied across Indian microregions, illustrating the insight that granular data can deliver. Life spans increased less than three years in New Delhi and Puducherry, while Uttar Pradesh and Chhattisgarh added more than seven years. In general, northern and eastern states, where life expectancy was lower in 2000, increased longevity faster, catching up with more advanced Indian states.

GDP per capita also grew across India, expanding at a compound annual growth rate of 6.6 percent nationally. As with life expectancy, however, states’ growth rates varied. For example, income rose almost ten percent annually in Sikkim but grew less than five percent in states like Mizoram and Rajasthan.

shutterstock_2133569335_SM shutterstock_2133569335_SM

These examples illustrate how much economic progress and better health are only visible at a granular level. Variation within countries can be substantial, and the common country lens we usually apply obscures microregional richness. We find that a country’s GDP per capita growth rate only explains about 20 percent of the variation in growth rates among its microregions.

There is no question that the Covid-19 pandemic stalled and even reversed some of the gains made over the two decades that preceded it in India and around the world. Restoring the momentum of progress will be important, and understanding how development unfolds at a granular level can help us learn from successful places while ensuring that resources are deployed where they’re most needed.

About authors: Chris Bradley and Jonathan Woetzel are Senior Partners, Sydney & Shanghai office, respectively, McKinsey & Company.

The thoughts and opinions shared here are of the author.

Check out our end of season subscription discounts with a Moneycontrol pro subscription absolutely free. Use code EOSO2021. Click here for details.

Post Your Comment
Required
Required, will not be published
All comments are moderated