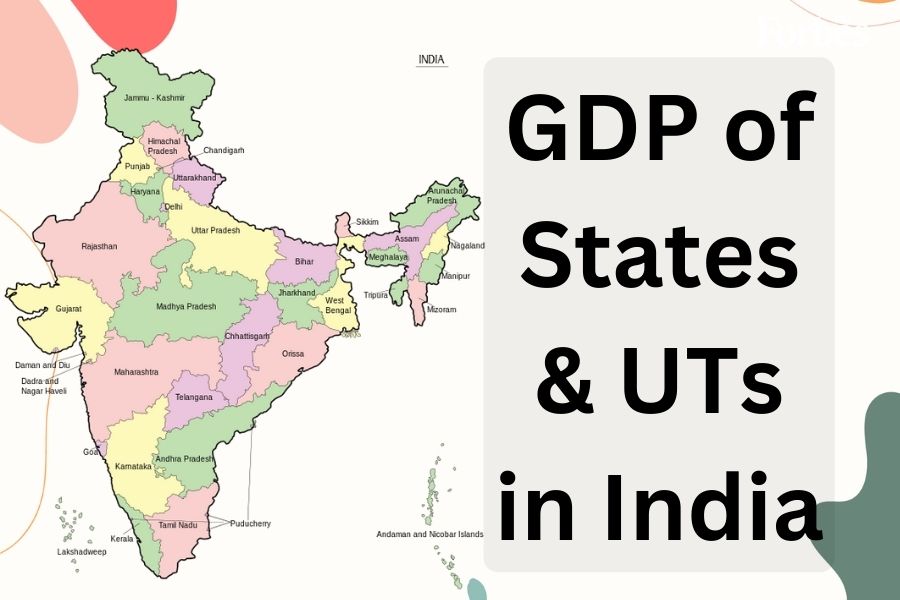
GDP of Indian states and union territories
Wondering which is the wealthiest state judging by the GDP of Indian states? In this article, we explore the GSDP and per capita GDP of Indian states


India, a diverse nation comprising 28 states, seven union territories, and a national capital territory (NCT), is a dynamic player in the global economic landscape. While the GDP of India in 2024 has reached $3.94 trillion in 2024, the respective GDP of Indian states showcases a vibrant picture of growth and development across regions. By examining the GDP and per capita GDP of Indian states, we can gauge each state and territory"s economic performance and growth rate.
GDP, or the gross domestic product, is a parameter to measure the value of all goods and services produced in a particular region. As for GDP per capita, it is a measure that represents the average economic output, or Gross Domestic Product (GDP), per person in a country. It is estimated by dividing the total GDP of a country by its population. Both these parameters gave an excellent notion of how much wealth the population holds in a particular region.
Therefore, a ranking by the GDP of Indian states is a good way to figure out our country"s richest and poorest states.
First Published: Sep 19, 2024, 09:45
Subscribe Now