After the Great Depression, when the federal government graded neighborhoods in hundreds of cities for real estate investment, Black and immigrant areas were typically outlined in red on maps to denote risky places to lend. Racial discrimination in housing was outlawed in 1968. But the redlining maps entrenched discriminatory practices whose effects reverberate nearly a century later.
California’s East Bay is a clear example.
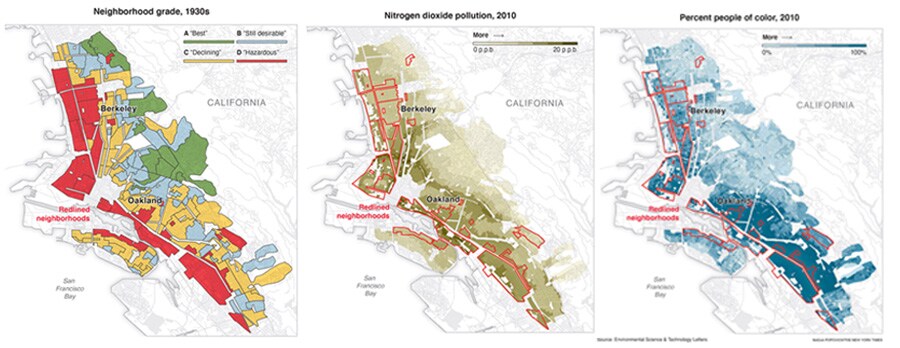
The neighborhoods within Berkeley and Oakland that were redlined are on lower-lying land, closer to industry and bisected by major highways. People in those areas experience levels of nitrogen dioxide that are twice as high as in the areas that federal surveyors in the 1930s designated as “best," or most favored for investment, according to the new pollution study.
Margaret Gordon has had decades of experience with these inequalities in West Oakland, a historically redlined neighborhood. Many children there have asthma related to traffic and industrial pollution. Residents have long struggled to fend off development projects that make the air even worse.
“Those people don’t have the voting capacity or the elected officials or the money to hire the lawyers to fight this," said Gordon, co-director of the West Oakland Environmental Indicators Project, an advocacy group.
The new study’s lead author, Haley M. Lane, said she was surprised to find that the differences in air pollution exposure between redlined and better-rated districts were even larger than the well-documented disparities in exposure between people of color and white Americans.
“At the same time, there are so many other effects that are creating these disparities, and these delineations by redlining are just one," said Lane, a graduate student in civil and environmental engineering at the University of California, Berkeley.
Researchers have unearthed patterns of all kinds since scholars digitized a large collection of redlining maps in 2016.
With less green space and more paved surfaces to absorb and radiate heat, historically redlined neighborhoods are 5 degrees hotter in summer, on average, than other areas. A 2019 study of eight California cities found that residents of redlined neighborhoods were twice as likely to visit emergency rooms for asthma.
The latest study, which was published Wednesday in the journal Environmental Science & Technology Letters, looked at neighborhoods in 202 cities and their exposure to two pollutants that are harmful to human health: nitrogen dioxide, a gas associated with vehicle exhaust, industrial facilities and other sources and dangerous microscopic particles known as PM 2.5. The study was funded in part by the U.S. Environmental Protection Agency.
![]()
Urban neighborhoods that were redlined by federal officials in the 1930s tended to have higher levels of harmful air pollution eight decades later
Joshua S. Apte, an assistant professor of civil and environmental engineering at Berkeley who worked on the study, said he had assumed the differences between neighborhoods would be more pronounced in certain regions, like the South. Instead, the patterns he and his colleagues found were remarkably consistent across the country.
“This history of racist planning is so deeply ingrained in American cities basically of any stripe, anywhere," Apte said. “We went looking for this regional story, and it’s not there."
The surveyors hired by the government in the 1930s gave each neighborhood one of four letter grades, from most to least desirable. And the new study found that “D" neighborhoods, the least desirable, decades later are generally more exposed to dirty air, and more of their residents live near highways, railroads and industrial pollution sources.
In part, this is because some areas graded “C" or “D" in the 1930s already hosted heavy industry and other sources of pollution. Over time, a lack of investment in these neighborhoods also made them attractive for new polluting projects, like interstate highways, that required cheap land.
One limitation of the study is that it looks at demographic and pollution information only from 2010. When the researchers started their analysis, information from the 2020 census was still being collected, they said. They reran their analysis using 2015 pollution data and found consistent trends.
Air pollution has decreased overall in the United States since 2010, although other research suggests racial and income disparities in exposure have persisted.
The racial makeup of some cities has also changed over the past decade because of gentrification and other factors, and more research needs to be done to determine how this affected pollution inequalities, said Rachel Morello-Frosch, an environmental health scientist at Berkeley who contributed to the study.
Given how much some cities have grown since the 1930s, the neighborhoods in the redlining maps only encompass a portion of the population there today. Even so, disparities in Americans’ exposure to air pollution in those cities are often not hard to spot.
Leticia Gutierrez, the government relations and community outreach director at Air Alliance Houston, an environmental group, said concrete plants often end up built in the city’s minority neighborhoods because developers believe people there are less likely to object.
Language barriers deter some residents from participating in public hearings. Only recently have state authorities begun publishing more information in Spanish and Vietnamese, Gutierrez said.
When Gutierrez wants to take her children to the park, she goes across town from her home in the east side of Houston, which is heavily Hispanic.
“It just feels like every time that you want to have a picnic or want to be outside, especially on a beautiful day, it just doesn’t smell right," she said. “And you go to the west side, and you’re like, ‘OK, I can breathe here.’"